

The Countdown Begins
May 2, 2023
 Welcome to the first Scissors Cut sampling report for 2023. We will be tracking hay growth and quality each week at 43 sites across our region on all sorts of fields at a range of elevations. You should find several sites that are similar to your farm.
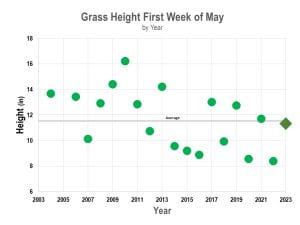
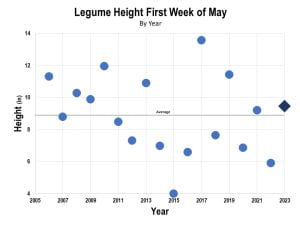
The charts below show grass and legume heights measured the first week of May from 2006 – 2023. Grass and legumes are right at the average, so maybe this year will be “normal”, whatever that is. Warm weather can push the hay fields to change quickly, so keep watch for next week’s results to make sure you are prepared. Over the years grass fields have hit dairy quality target fiber content about May 16. Now is the time to get everything shined up and ready for go time.
The Table at the bottom has each sample location, listed by Town and elevation, and lists the species sampled, average height, Neutral Detergent Fiber (NDF), Neutral Detergent Fiber Digestibility (NDFD), and Total Digestible Nutrients (TDN). We have sampled grass, legume and mixed legume/grass fields across the region and at elevations from 1070 to 2240 feet. Look for locations with similar forage type and elevation to your farm.
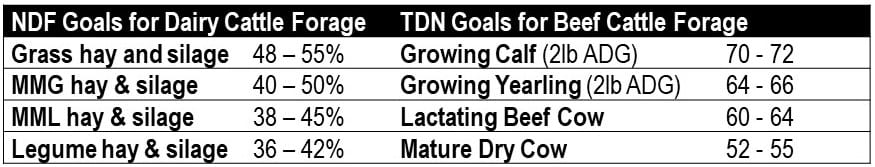
 We will be reporting several measures of forage quality. Different types and groups of cattle have different demands and each measure tells a slightly different story. If harvesting for dairy forage, we suggest harvesting based on NDF, for beef choose and appropriate TDN target or the animals you will be feeding.
We will be reporting several measures of forage quality. Different types and groups of cattle have different demands and each measure tells a slightly different story. If harvesting for dairy forage, we suggest harvesting based on NDF, for beef choose and appropriate TDN target for the animals you will be feeding.
NDF – Neutral Detergent Fiber is a measure of the structural fiber in a feed sample. NDF correlates well with how much forage a cow can eat (gut fill). Earlier cut hay = lower NDF = higher dry matter intake = higher performance.
NDFD – NDF Digestibility As forage plants mature, the fiber percentage increases, and at the same time the digestibility of the fiber decreases. NDFD measures the digestibility of fiber by rumen fluid. We report 24hr NDFD as an indicator of forage digestibility. Higher digestibility = more energy available from a forage.
TDN – Total Digestible Nutrients The sum of the digestible fiber, protein, lipid, and carbohydrate components. TDN is a measure of energy available from forage and is related to digestible energy. TDN is useful for beef cow rations that are primarily forage. Higher TDN values indicate higher energy available, cattle groups with higher energy demands require higher TDN intakes.
Special thanks to Dairy One for providing the sample analysis
| Delaware County Scissor Cuts Results | May 32, 2023 | |||||
| Town | Elev | Species | Ht | aNDFom | NDFD | TDN |
| Andes | 1505 | Red Clover | 11 | 27.7 | 58 | 72 |
| Andes | 1500 | Mixed Grasses | 10 | 39.3 | 79 | 67 |
| Andes | 1412 | Orchardgrass | 12 | 40.7 | 79 | 67 |
| Andes | 2240 | Mixed Grasses | 7 | 39.7 | 73 | 67 |
| Andes | 1960 | RClov(35%)Grass | 6/10 | 35.7 | 72 | 68 |
| Colchester | 1080 | Alf(60%)Tfesc | 14/13 | 34.9 | 64 | 67 |
| Davenport | 1285 | Alfalfa | 16 | 30.1 | 66 | 68 |
| Delhi | 1380 | Mixed Grasses | 10 | 47.1 | 73 | 67 |
| Delhi | 1340 | Alfalfa | 18 | 27.2 | 71 | 68 |
| Delhi | 1400 | Clov(25%)Grass | 7/13 | 42.9 | 77 | 67 |
| Delhi | 1610 | Mixed Grasses | 13 | 41.8 | 73 | 67 |
| Delhi | 1425 | Orchardgrass | 12 | 46.3 | 73 | 65 |
| Franklin | 1260 | Alf(50%)Orch | 11/17 | 35.9 | 76 | 67 |
| Franklin | 1650 | Mixed Grasses | 16 | 36.2 | 83 | 69 |
| Franklin | 1720 | Mixed Grasses | 11 | 43.3 | 78 | 68 |
| Halcott | 1730 | Orchardgrass | 15 | 43.3 | 76 | 67 |
| Hamden | 2100 | Clov(50%)Grass | 5/9 | 38.5 | 72 | 67 |
| Hamden | 1490 | Mixed Grasses | 6 | 39.3 | 75 | 69 |
| Hardenburgh | 1670 | Orchardgrass | 10 | 45.7 | 71 | 67 |
| Kortright | 2000 | Tall Fescue | 11 | 38.9 | 84 | 70 |
| Kortright | 1860 | Orchardgrass | 14 | 46.4 | 71 | 67 |
| Meredith | 2230 | Orchardgrass | 7 | 32.8 | 80 | 72 |
| Meredith | 2100 | Orchardgrass | 7 | 40 | 74 | 68 |
| Meredith | 1600 | Tall Fescue | 10 | 43.1 | 77 | 66 |
| Middletown | 2060 | Orch/Rcanary | 14 | 41.9 | 77 | 67 |
| Middletown | 2020 | Reed Canarygrass | 15 | 42.5 | 79 | 66 |
| Neversink | 1420 | Tall Fescue | 10 | 38.4 | 92 | 70 |
| Neversink | 1700 | Mixed Grasses | 4 | 42.1 | 74 | 67 |
| Roxbury | 1950 | Mixed Grasses | 11 | 43.9 | 75 | 69 |
| Roxbury | 1890 | Orchardgrass | 10 | 44 | 75 | 67 |
| Roxbury | 1980 | Mixed Grasses | 8 | 41.7 | 71 | 66 |
| Roxbury | 1830 | Orchardgrass | 15 | 42.5 | 75 | 66 |
| Sidney | 1070 | Orchardgrass | 14 | 40.2 | 76 | 70 |
| Sidney | 1070 | Alfalfa | 13 | 28.8 | 70 | 67 |
| Stamford | 1510 | Orchardgrass | 9 | 42.7 | 74 | 68 |
| Stamford | 1488 | Alfalfa | 10 | 29.7 | 69 | 67 |
| Stamford | 1560 | Alf(40%)Orch | 10/14 | 35.9 | 71 | 66 |
| Stamford | 1800 | Mixed Grasses | 9 | 42 | 69 | 69 |
| Stamford | 2080 | Mixed Grasses | 10 | 43 | 75 | 68 |
| Tompkins | 1210 | Clov(25%)Grass | 6/12 | 45.3 | 74 | 67 |
| Tompkins | 1235 | Clov(35%)Grass | 7/13 | 46.3 | 78 | 66 |
| Walton | 1170 | Alf(40%)Orch | 11/15 | 42.2 | 72 | 67 |
| Walton | 1240 | Clov(30%)Grass | 10/14 | 39.6 | 79 | 68 |
| Av Grass Ht | 9.5 | |||||
| Av Legume Ht | 11.3 | |||||